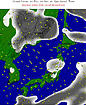
Sea Level Pressure and 1000-500mb Thickness
* The colored contours indicate sea level pressure in millibars. High pressure is red, low pressure in green or blue. Only the last 2 digits shown -- sea level pressure is usually around 1000 millibars, so add 1000 to values in the range of 00-50, and add 900 to values in the range of 50-98.
* Low sea level pressure indicates cyclones or storms near the surface of the earth. High sea level pressure indicates calm weather.
* The black contours indicate the vertical distance, or thickness, between the 1000 millibar surface and the 500 millibar surface, measured in tens of meters.
* Since air behaves nearly as an ideal gas, and vertical distance is proportional to volume over a specified surface area, the thickness between two pressure levels is proportional to the mean temperature of the air between those levels. Thus, low values of thickness mean relatively cold air.
* The 540 line is highlighted, since this line is often used as a rule of thumb to indicate the division between rain and snow for low terrain. When there is precipitation where the thickness is below 540dam, it is generally snow. If the thickness is above 540dam, it is usually rain (or sleet if the air next to the surface is below freezing)
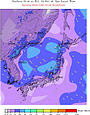
Vertical Velocity and Precipitation
*The colored contours indicate vertical velocity of the wind at the 700 millibar level, in millibars per hour (since pressure decreases with height, negative values indicate ascending air, and positive values denote sinking).
*Ascending motion is associated with cloudiness and rain. Large negative values of vertical velocity correspond to areas of heavy rainfall if moisture is available. These areas tend to correspond with the storms.
*The green shading in the forecasts indicate 12 or 24 hour accumulated precipitation, measured in millimeters.
*The total is the amount of rainfall forecast during the 12 or 24 hours immediately preceding the verification time in the lower lefthand corner of the map.
*Comparison with the 540 thickness line, and the 0ºC isotherm in panel 4 can give a good indication of the dividing line between snow and rain.
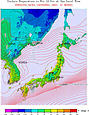
850mb Temperature, Humidity and Winds
*Colored contours indicate the air temperature at the 850 millibar level, in degrees Celsius. The 0ºC contour is highlighted, as this is also often used as a divider between rain and snow.
*The green shading indicates the relative humidity percentage at the 850 millibar level. High values indicate the availability of moisture. When large rates of ascent are located with high moisture availability, heavy rainfall will likely occur.
*The barbs indicate the direction and speed of the wind, in meters per second. Each full barb indicates 10 m/s, and each half barb 5 m/s. The direction of the wind is parallel to the shaft with the barbs pointing into the wind.
*Advection of moisture by the wind can be inferred by noticing the direction and rate at which moist areas appear to be blown. Similarly, temperature advection can be inferred by noticing whether the wind is blowing cold air toward a warm region, or warm air toward a cold region.
|